Building a Full DevSecOps Pipeline: From Git to Production
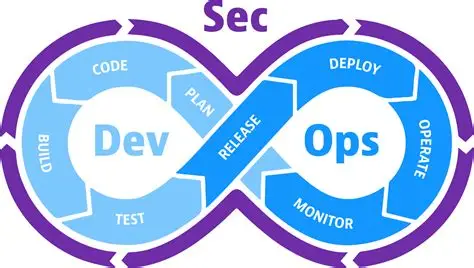
This is the deep-dive version of a project I’m genuinely proud of: a production DevOps infrastructure built for the SecOps Club at ENSA Fès, hosting two live services — a public club website and a CTF (Capture The Flag) competition platform. It was built as part of a Cloud Computing module, but the scope quickly grew past “school project” into something closer to a real industrial pipeline: Git → Jenkins → Docker → Nginx → Cloudflare, with a DevSecOps layer (Trivy vulnerability scanning) and a full observability stack (Prometheus + Grafana + Telegram alerting) bolted on top.
Everything below reflects what’s actually running in production at project-cloud.online, not a toy lab setup.
Stack at a glance
| Layer | Technology | Role |
|---|---|---|
| Version control | Git + GitHub | Source of truth, webhooks |
| Containerization | Docker + Docker Compose | Service isolation & orchestration |
| CI/CD | Jenkins 2.541 LTS (JDK 21) | Build, security scan, deploy |
| Reverse proxy | Nginx (stable-alpine) | Multi-domain HTTP/HTTPS routing |
| DNS & edge security | Cloudflare | DDoS protection, CDN, TLS |
| Hosting | AWS EC2 (Ubuntu 22.04) | Production server |
| Frontend | React 18 + Nginx | SecOps Club website |
| CTF platform | CTFd + MariaDB + Redis | Cybersecurity competitions |
| Security scanning | Trivy (Aqua Security) | Container image vulnerability scanning |
| Monitoring | Prometheus + Grafana | Real-time observability |
| Alerting | Telegram bot | Instant CI/CD notifications |
Seven Docker containers run behind a single public entry point, coordinated by Docker Compose, with four Cloudflare-protected subdomains and end-to-end HTTPS.
1. Infrastructure architecture
Every request goes through Cloudflare before it ever touches the EC2 instance — that’s the first line of defense against DDoS and drive-by scanning. Behind Cloudflare, the architecture splits into three zones: the public edge (Cloudflare DNS/TLS/WAF), the EC2 network layer (only ports 80/443/50000 exposed), and a private Docker layer split into two isolated networks.
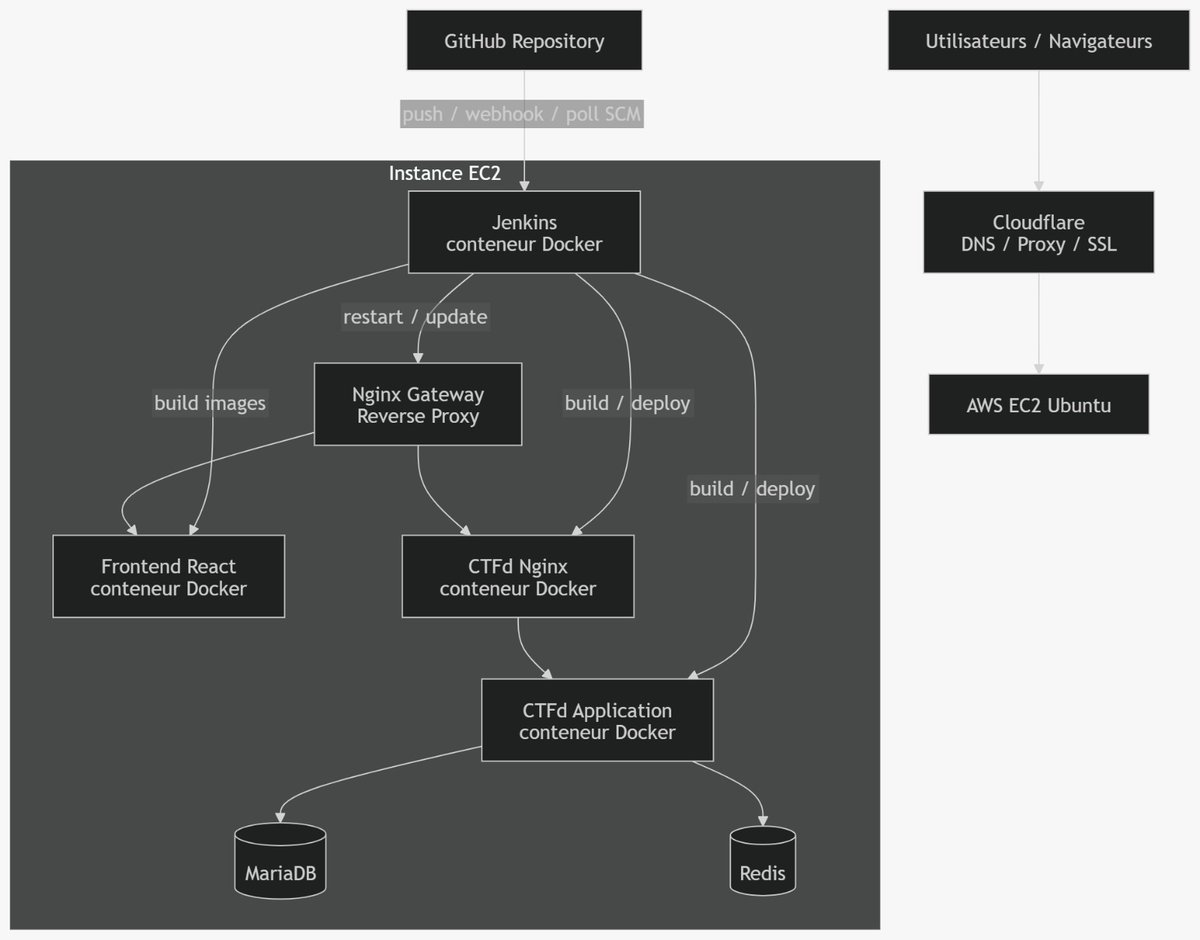 Architecture overview — Cloudflare → EC2 → Docker, with public and isolated network zones.
Two Docker networks enforce that isolation:
secops-net(external bridge): gateway, frontend, CTFd’s internal Nginx, and Jenkins all talk to each other here.internal(isolated bridge,internal: true): MariaDB and Redis live here with zero direct internet access. Only the CTFd container can reach them, fromsecops-net. Even if another container got compromised, it couldn’t reach the database directly.
A request to the main site follows this path: browser → Cloudflare (DNS resolution + HTTPS proxy) → secops-gateway (Nginx, TLS termination with the Cloudflare Origin certificate) → secops-frontend (port 80 internal) → response bubbles back the same way. The database and cache are never in that path.
On the AWS side, a t2/t3.small Ubuntu 22.04 instance runs in us-east-1, with a Security Group locked down to exactly three inbound rules: 80, 443, and 50000 (Jenkins agents). Everything else is dropped at the firewall regardless of what’s configured inside the containers.
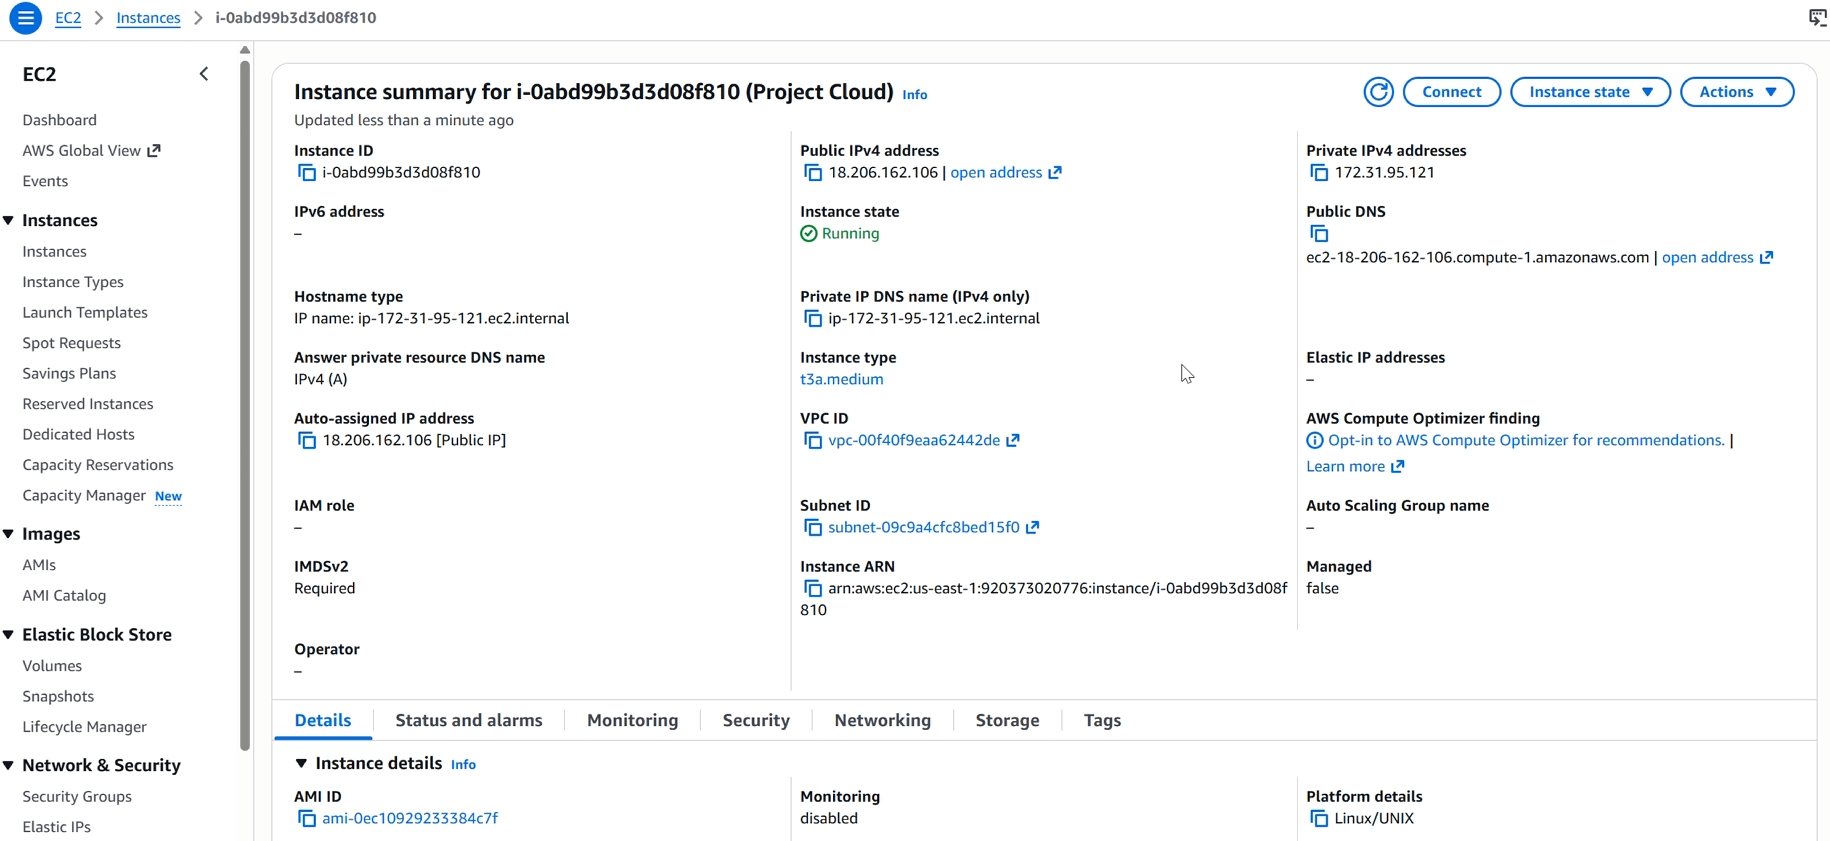 The EC2 instance backing the whole stack — Ubuntu 22.04, fixed public IP, locked-down Security Group.
And here’s the proof it’s actually running seven services, not just diagrams on paper:
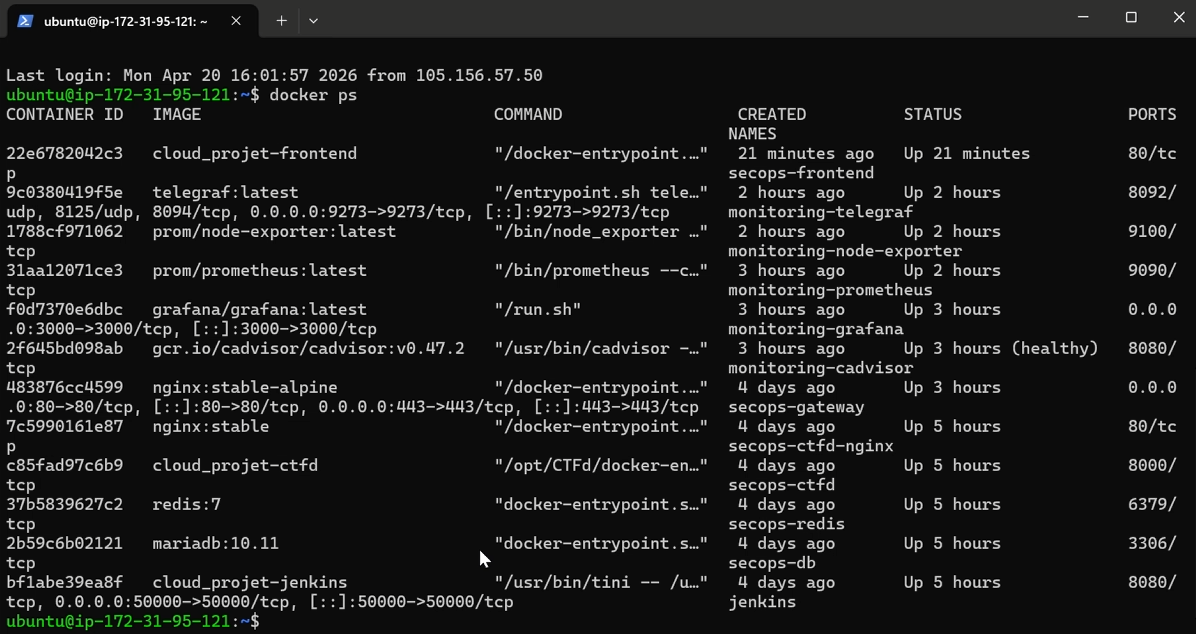
docker ps on the EC2 host — gateway, frontend, ctfd, ctfd-nginx, db, redis, jenkins, all Up.
2. Reverse proxy: one gateway, three domains
secops-gateway (Nginx) is the only public entry point. It does virtual hosting by Host header across three domains, handles the HTTP→HTTPS redirect for all of them, and terminates TLS using a Cloudflare Origin certificate — decrypting inbound HTTPS, forwarding plain HTTP internally, then letting Cloudflare re-encrypt on the way back out. This is “SSL offloading,” and it means none of the backend containers have to deal with certificates at all.
| Incoming domain | Backend container | Backend port |
|---|---|---|
project-cloud.online / www.* | secops-frontend | 80 |
ctf.project-cloud.online | secops-ctfd-nginx | 80 |
jenkins.project-cloud.online/jenkins | jenkins | 8080 |
The Jenkins route needed a proxy_redirect rewrite rule — without it, Jenkins keeps generating internal http://jenkins:8080/... redirects that never reach the browser correctly. That one line cost a few debugging sessions before I found it.
3. DNS and edge security: Cloudflare
DNS for project-cloud.online (registered via Namecheap) is fully delegated to Cloudflare through custom nameservers. Four A records — root, www, ctf, jenkins — all point at the same EC2 IP, all in Proxied mode (the orange cloud icon), meaning visitors never see the real server IP, only Cloudflare’s anycast addresses.
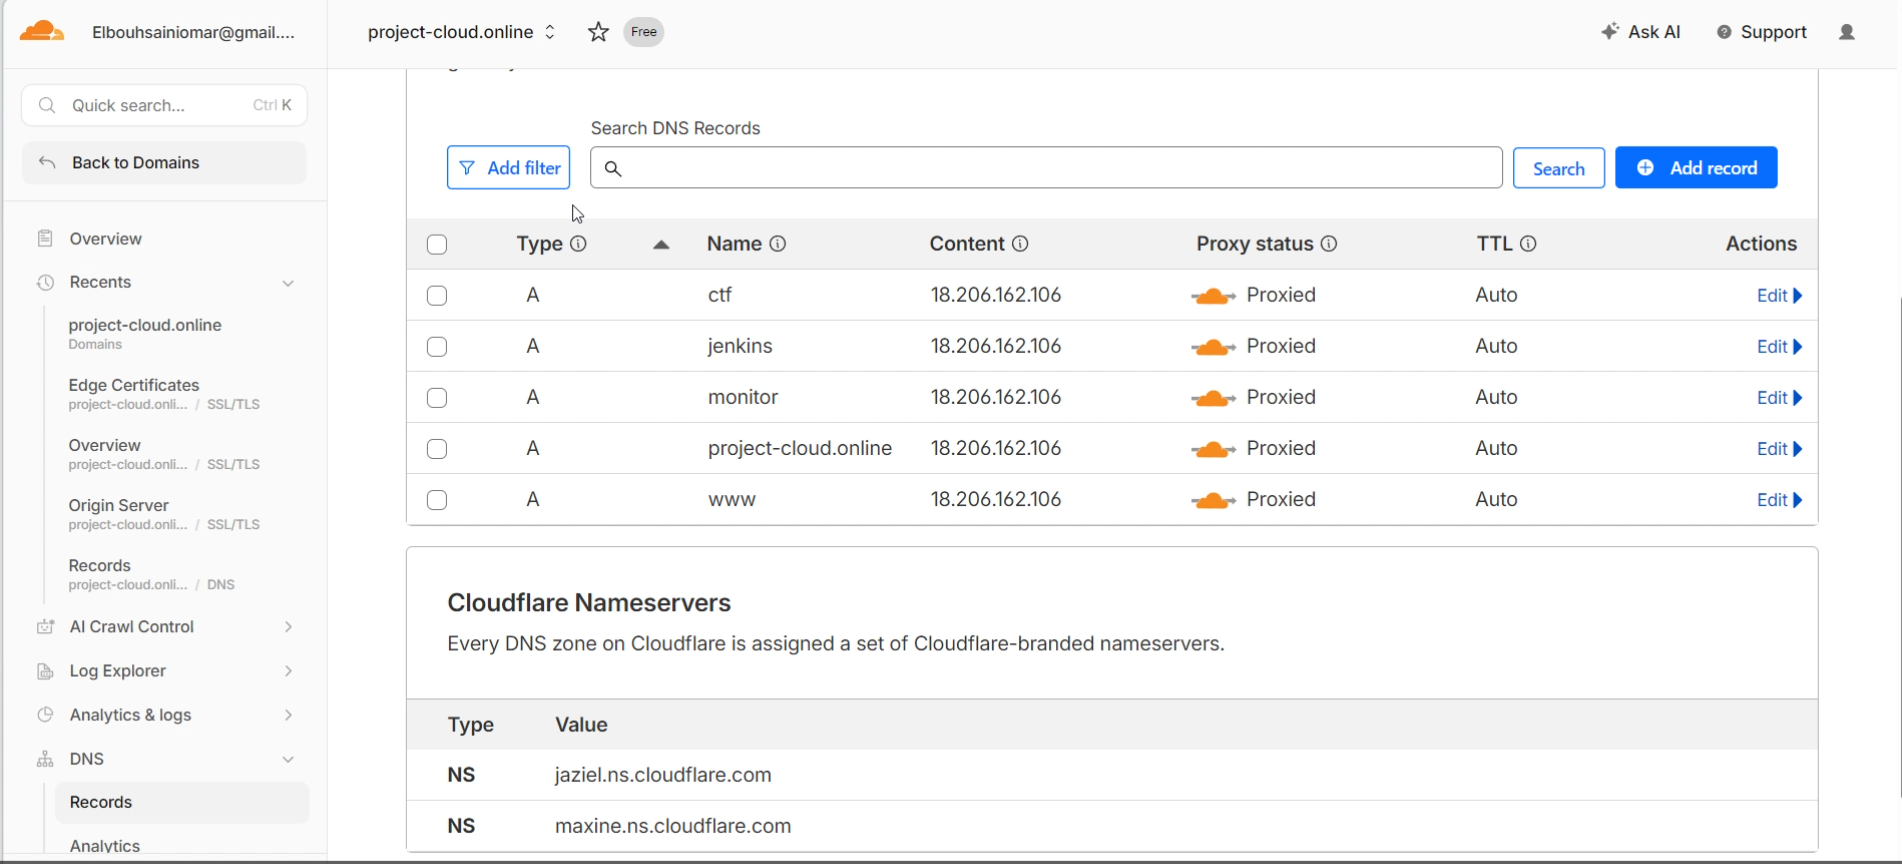 Cloudflare DNS records for all four subdomains, all proxied.
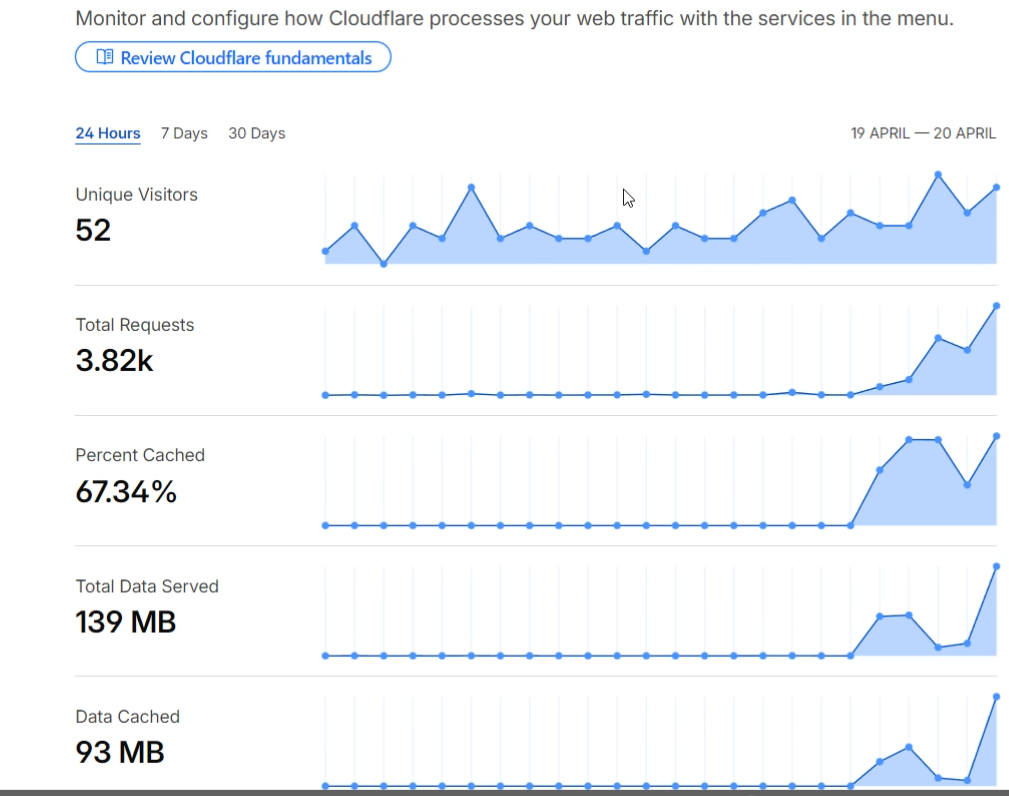 24h traffic view — request volume, blocked requests, and geographic distribution.
The TLS model is “Full (Strict)”: browser ↔ Cloudflare uses a public Cloudflare-issued certificate, and Cloudflare ↔ EC2 uses a separate Origin certificate, valid only for that specific tunnel. Both legs are encrypted; neither leg trusts the other implicitly.
4. CI/CD: GitHub webhook → Jenkins → Docker
This is the core automation loop. Every push to main triggers a GitHub webhook (POST to /jenkins/github-webhook/), which fires the pipeline immediately — no polling delay.
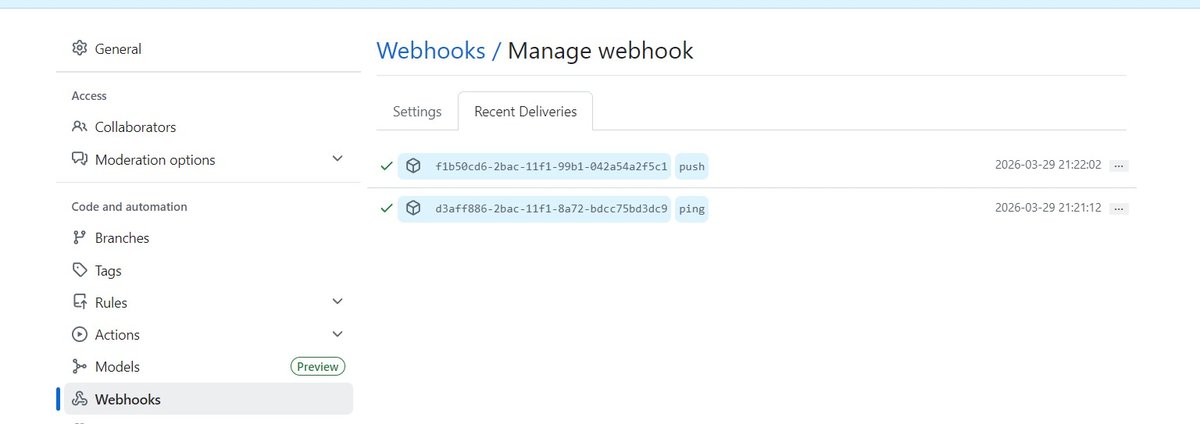 GitHub’s webhook delivery log — the initial ping plus real pushes, all acknowledged with HTTP 200.
The Jenkinsfile is a declarative Groovy pipeline, versioned in the repo itself (Pipeline-as-Code). In its simplest form it has two stages:
1
2
3
4
5
6
7
8
9
10
11
12
13
14
15
16
17
18
19
20
21
22
23
24
25
26
pipeline {
  agent any
  stages {
    stage('Check Tools') {
      steps {
        sh '''
          docker version
          docker-compose version
          git --version
        '''
      }
    }
    stage('Deploy') {
      steps {
        sh '''
          set -e
          git config --global --add safe.directory /home/ubuntu/cloud_projet
          cd /home/ubuntu/cloud_projet
          git pull origin main || true
          docker-compose -f docker-compose.prod.yml build frontend ctfd ctfd-nginx
          docker-compose -f docker-compose.prod.yml up -d --no-deps frontend ctfd ctfd-nginx
        '''
      }
    }
  }
}
Two details matter more than they look:
set -estops the deploy immediately on any failed command — no half-applied deployments.--no-depsis what keeps this zero-downtime: it rebuilds and restarts only the frontend/CTFd services, without touching the gateway, database, cache, or Jenkins itself.
Jenkins runs as a container too, with the host’s Docker socket (/var/run/docker.sock) mounted in — a lightweight alternative to true Docker-in-Docker that lets Jenkins run docker build directly against the host daemon.
The first six builds were rough — Docker socket permissions, Git’s “dubious ownership” safety check (Jenkins runs as root, the repo is owned by ubuntu), and the Nginx proxy-redirect issue mentioned above all had to get fixed one at a time.
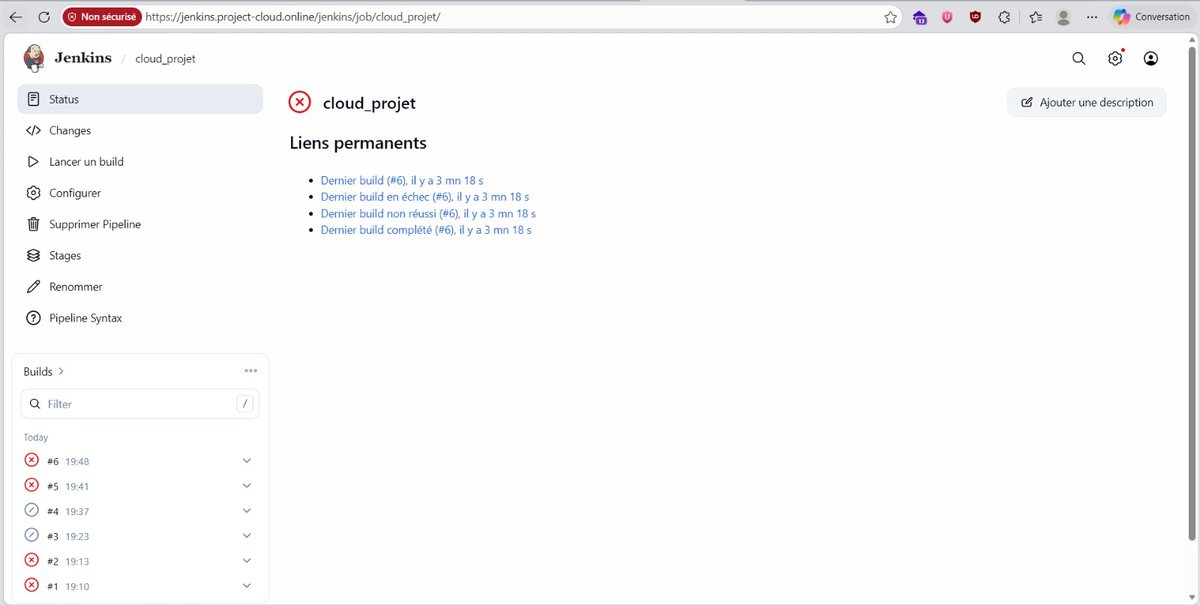 The rough early days — red builds while I chased down socket permissions, Git ownership, and proxy header issues.
Once stabilized, the loop closes in under a minute, fully automatically:
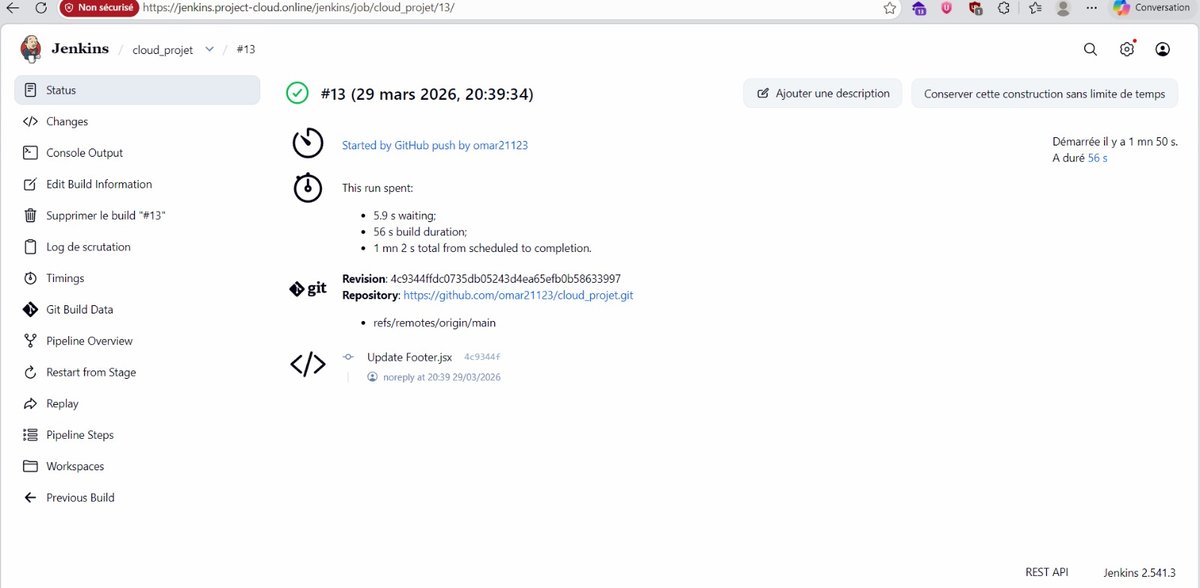 Build #13 — triggered by an “Update Footer.jsx” push, 56 seconds from commit to redeploy, no manual step.
5. DevSecOps: shifting security left with Trivy
A CI/CD pipeline without a security gate just ships vulnerabilities faster. So I added a Trivy scan stage between build and deploy:
1
2
3
4
5
6
7
8
9
10
11
stage('Security Scan — Container Image') {
  steps {
    sh '''
      trivy image \
        --exit-code 1 \
        --severity CRITICAL,HIGH \
        --no-progress \
        cloud_projet-frontend:latest
    '''
  }
}
--exit-code 1 is the important part — if Trivy finds a CRITICAL or HIGH vulnerability, the stage fails and the pipeline stops. No image with known-critical flaws reaches production, automatically, with no human gatekeeping.
The first real scan was a wake-up call: 204 vulnerabilities on cloud_projet-frontend:latest — 150 HIGH, 54 CRITICAL.
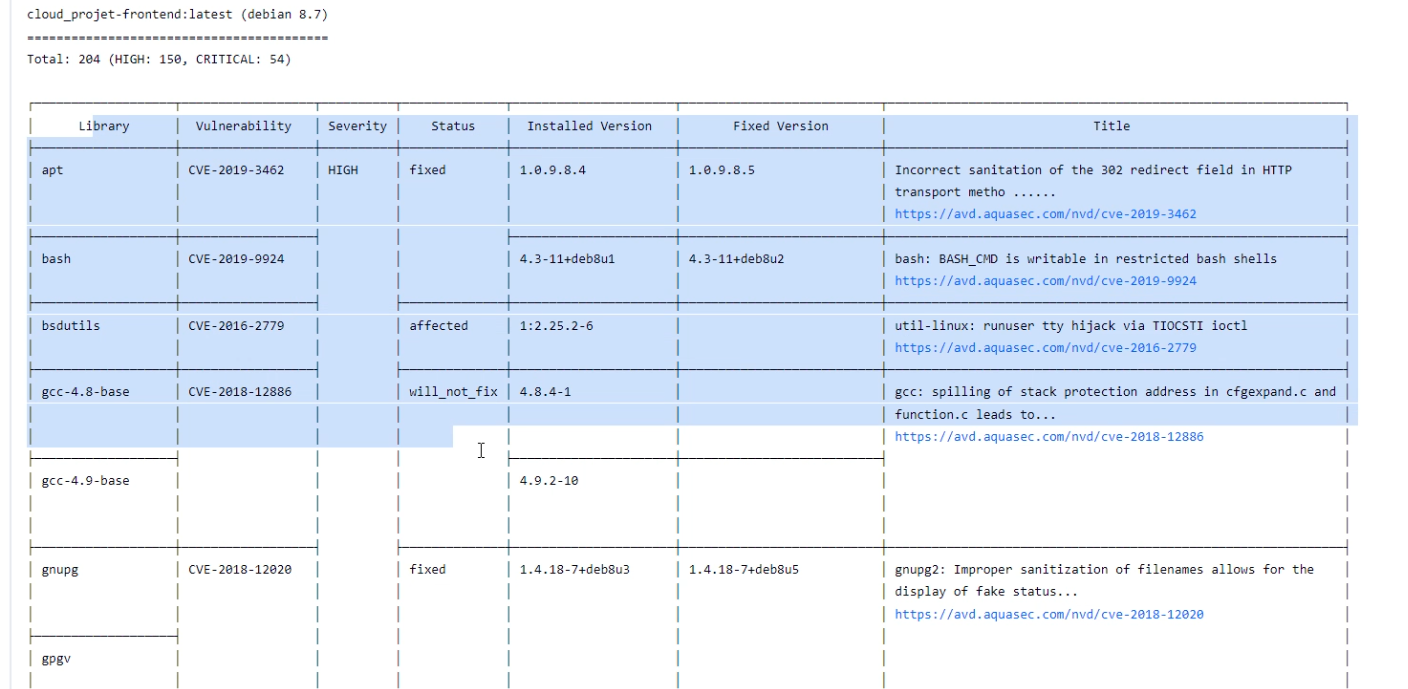 Trivy’s report: 204 vulnerabilities, none of them from the actual React code.
None of that came from the application code — it all traced back to the Dockerfile’s base image, node:18 on Debian 8 “Jessie,” which reached end-of-life in June 2020. Notable CVEs included a MITM flaw in APT’s redirect handling (CVE-2019-3462), a restricted-shell bypass in bash (CVE-2019-9924), and a TTY-hijacking bug via ioctl TIOCSTI in bsdutils (CVE-2016-2779).
The fix was straightforward once identified: swap the build stage’s base image from node:18 (~1.1 GB, Debian-based) to node:18-alpine (~180 MB, musl + busybox, drastically smaller attack surface) — matching the production stage, which was already on nginx:alpine.
I also intentionally let the gate do its job once, to prove it actually blocks bad images rather than just logging them:
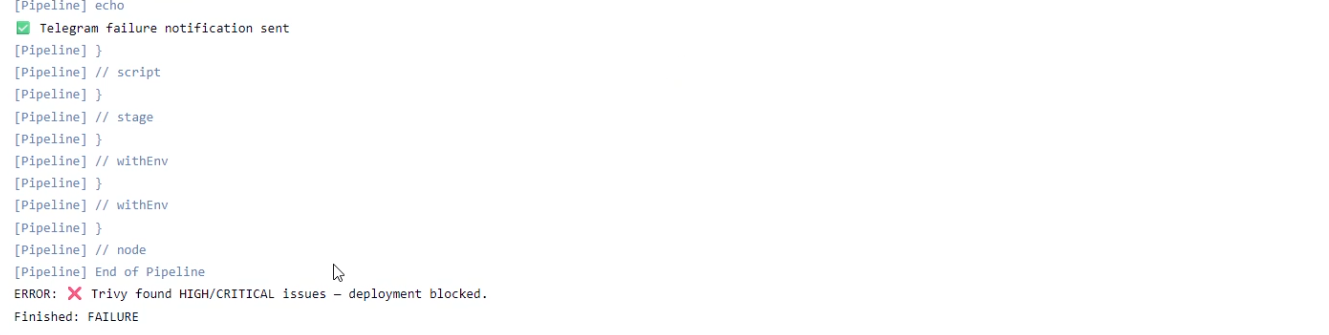 Build #78 — Security Scan stage fails red, Deploy never runs. The vulnerable image never left the pipeline.
6. Observability: Prometheus, Grafana, and knowing what “normal” looks like
A CI/CD pipeline automates deployment; monitoring watches what happens after. Without metrics, a memory leak, full disk, or CPU spike is invisible until it becomes an outage. The stack here is the standard combo: Node Exporter (host-level metrics — CPU, RAM, disk, network) and cAdvisor (per-container metrics — CPU, memory, disk I/O) feed Prometheus, which Grafana visualizes.
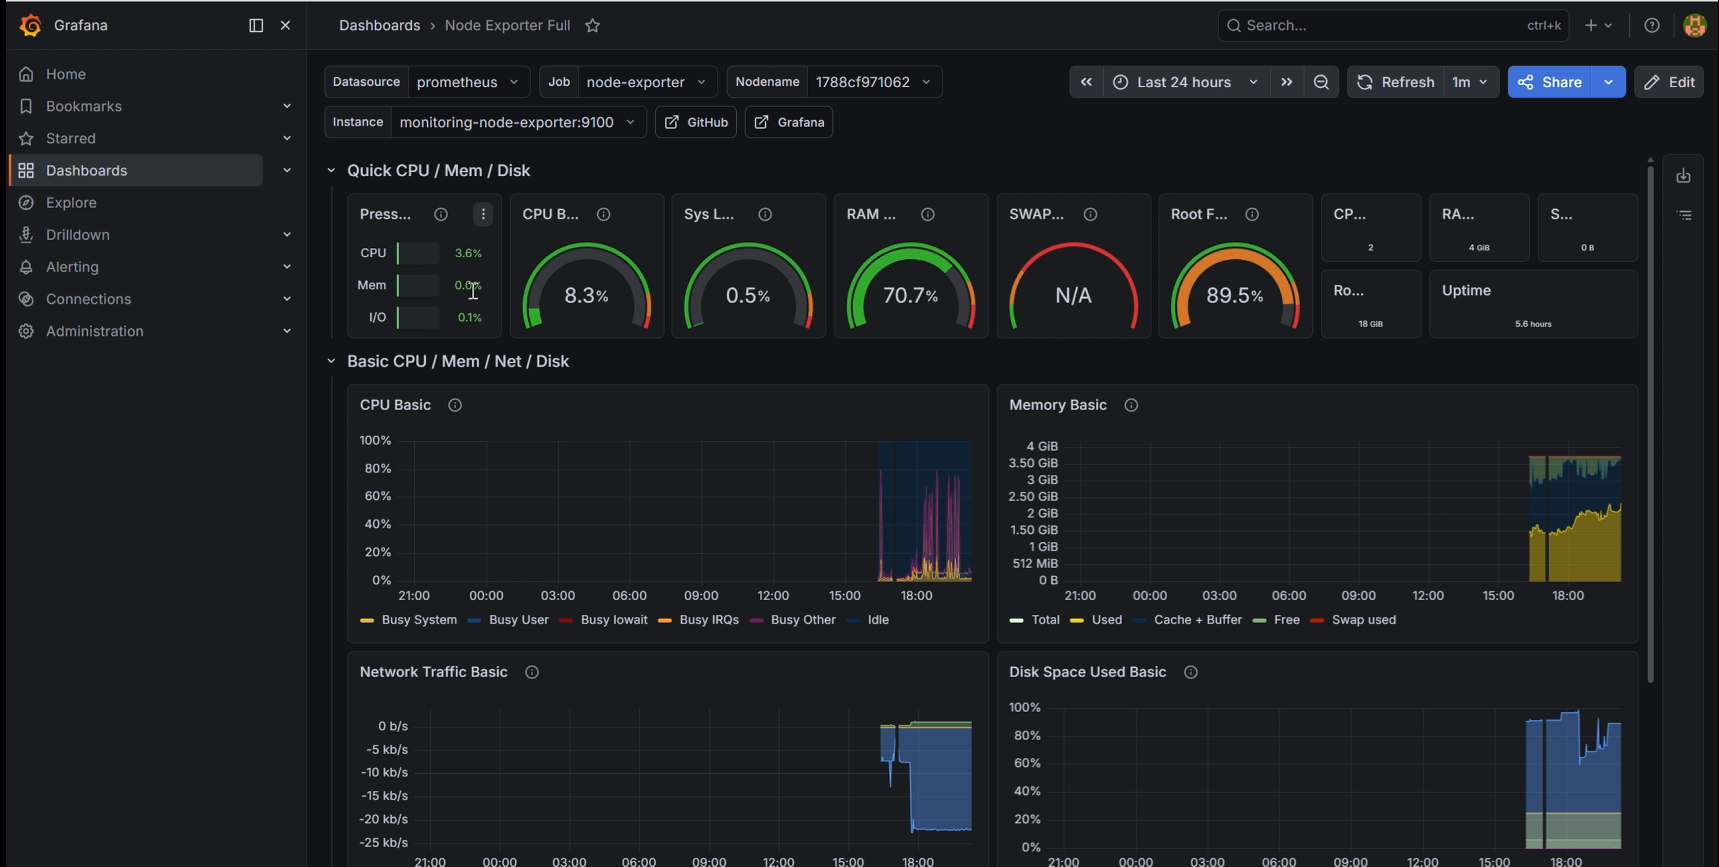 Node Exporter Full dashboard — 24h of host-level metrics for the EC2 instance.
Reading the numbers instead of just looking at pretty graphs: CPU averaged 6.8% busy, with spikes to ~80% lining up exactly with Jenkins builds (npm install + docker build are the culprits — expected and temporary). RAM sat at 65.4% (2.6 of 4 GiB), with Jenkins’s JVM (-Xms256m -Xmx768m) as the main consumer and no upward drift suggesting a leak. Root filesystem at 63% is Docker image layers accumulating — worth a scheduled docker image prune. Per-container I/O showed Jenkins as the dominant read/write source (constantly touching config, logs, and cloned repos in jenkins_home), with every other service essentially idle outside of active builds or CTF events — which is itself a useful baseline: if secops-db suddenly starts writing continuously, that’s a crash-loop, not normal behavior.
7. Instant alerting: a Telegram bot named “Cloud_Alert”
Nobody watches a Jenkins dashboard all day. So the pipeline’s post block pushes a message to a dedicated Telegram channel after every build, success or failure, with the commit, branch, duration, and a link straight to the logs — bot token and chat ID stored as Jenkins “Secret Text” credentials, never hardcoded.
1
2
3
4
5
6
7
8
9
10
11
12
13
14
post {
  success {
    script {
      def msg = "✅ *BUILD SUCCESS* — ${env.JOB_NAME}\nBuild: #${env.BUILD_NUMBER}\nCommit: ${env.GIT_COMMIT.take(7)}\nDuration: ${currentBuild.durationString}\nLogs: ${env.BUILD_URL}"
      withCredentials([
        string(credentialsId: 'telegram-bot-token', variable: 'BOT_TOKEN'),
        string(credentialsId: 'telegram-chat-id', variable: 'CHAT_ID')
      ]) {
        sh "curl -s -X POST https://api.telegram.org/bot${BOT_TOKEN}/sendMessage -d chat_id=${CHAT_ID} -d parse_mode=Markdown -d text='${msg}'"
      }
    }
  }
  failure { /* same idea, with a ❌ */ }
}
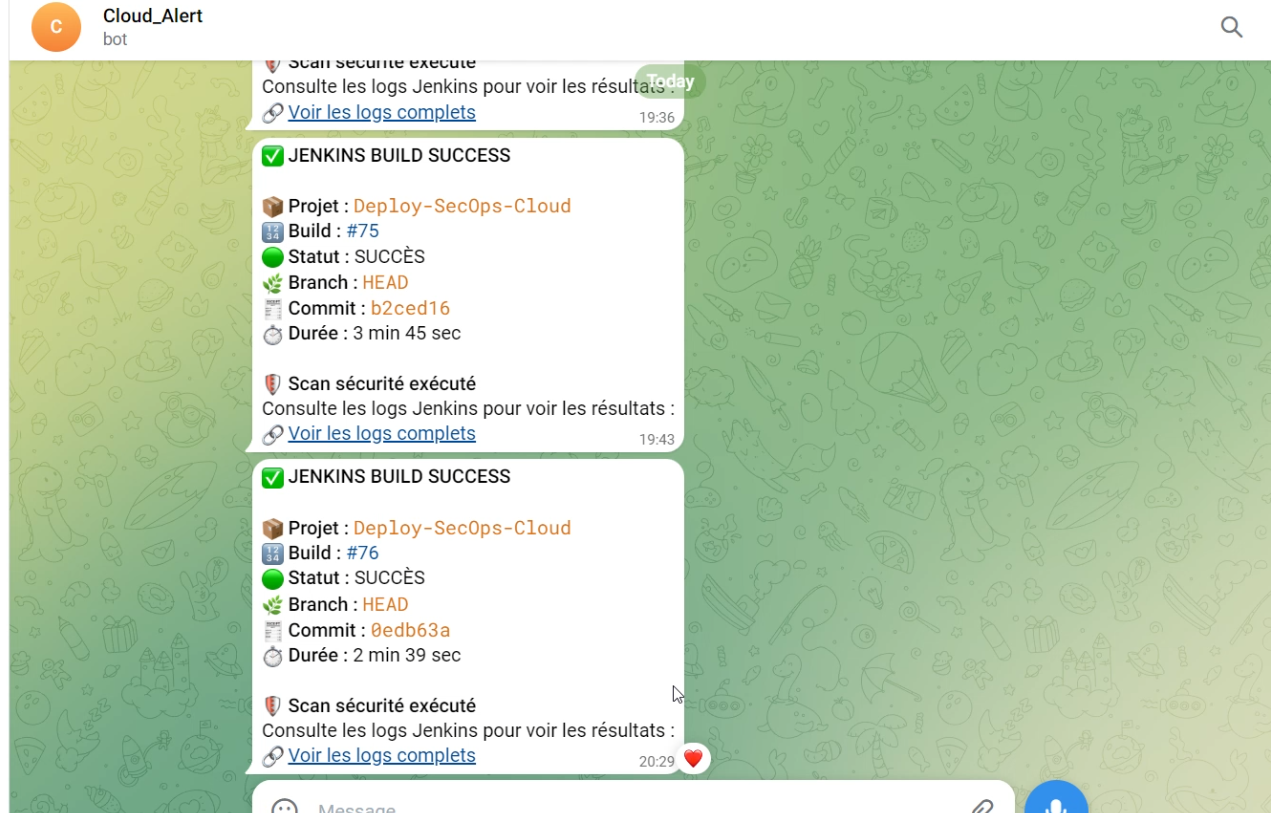 The Cloud_Alert channel in action: build #73 success, #74 blocked by Trivy, #75 success after the fix.
That #73 → #74 → #75 sequence is basically the whole DevSecOps story in one screenshot: a normal deploy, a real CRITICAL vulnerability catching the security gate red-handed, and a fix landing minutes later — all visible on a phone, without opening Jenkins once.
8. End-to-end walkthrough: shipping a footer change
To tie it all together, here’s exactly what happens when I push a one-line change to Footer.jsx:
git push origin main.- GitHub fires the webhook — Jenkins receives it in under a second.
- Build starts: Check Tools (~5s) → Security Scan / Trivy (~90s) → Deploy (~56s).
- Docker Compose rebuilds only the
frontendimage. - The
secops-frontendcontainer restarts with--no-deps— under 5 seconds, nothing else interrupted. - Telegram gets the ✅ notification with commit hash and duration.
- The change is live.
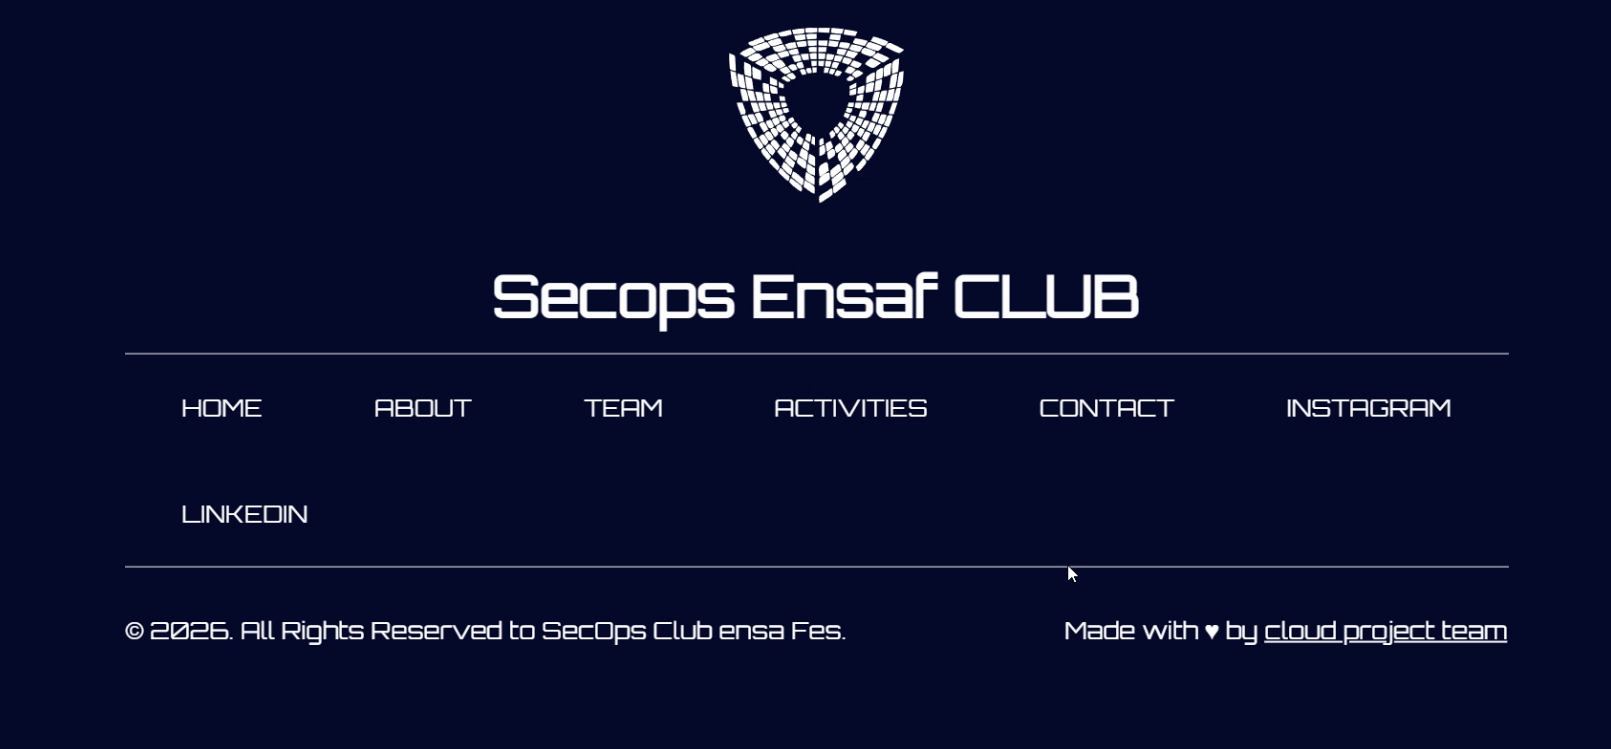 The updated footer, live on production seconds after the Telegram success notification.
Total time from git push to a visible change in production: about three minutes, most of it spent in the deliberately-thorough security scan stage.
9. What’s actually deployed
SecOps Club website (www.project-cloud.online) — a React 18 single-page app, multi-stage Docker build, served by Nginx (final image ~25 MB on the Alpine base). Home page, club presentation, team, activities, and contact sections.
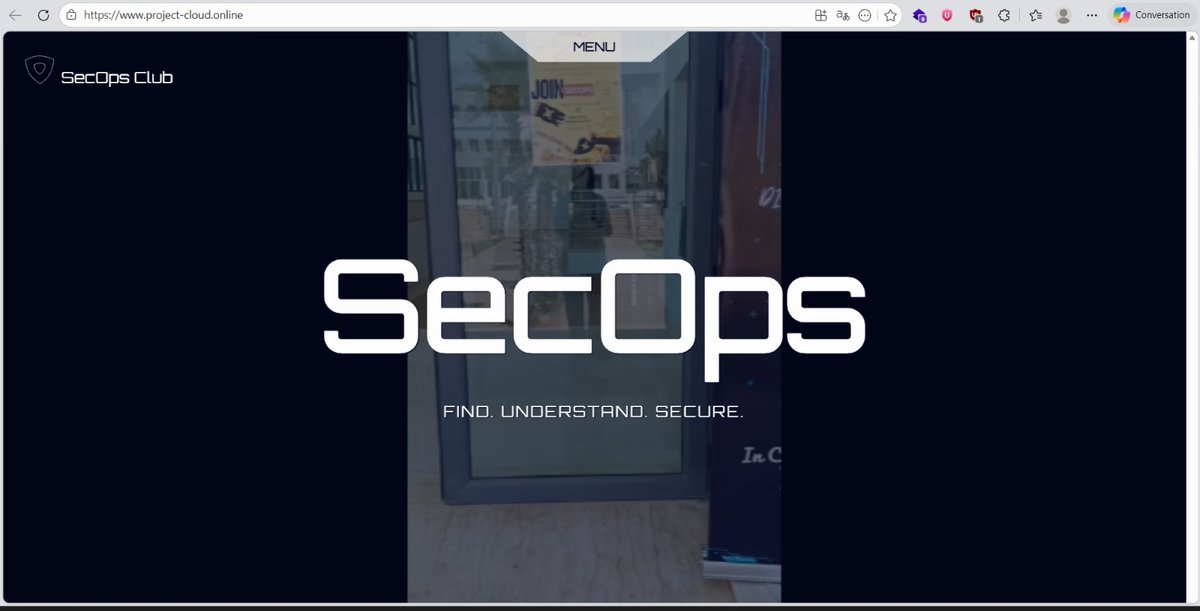 The SecOps Club site in production, served through the full pipeline described above.
CTFd platform (ctf.project-cloud.online) — a three-tier setup: MariaDB 10.11 for persistent storage (users, teams, challenges, scores), Redis 7 for session caching, and an internal Nginx reverse-proxying the CTFd Flask app. Both database and cache stay confined to the isolated Docker network from section 1.
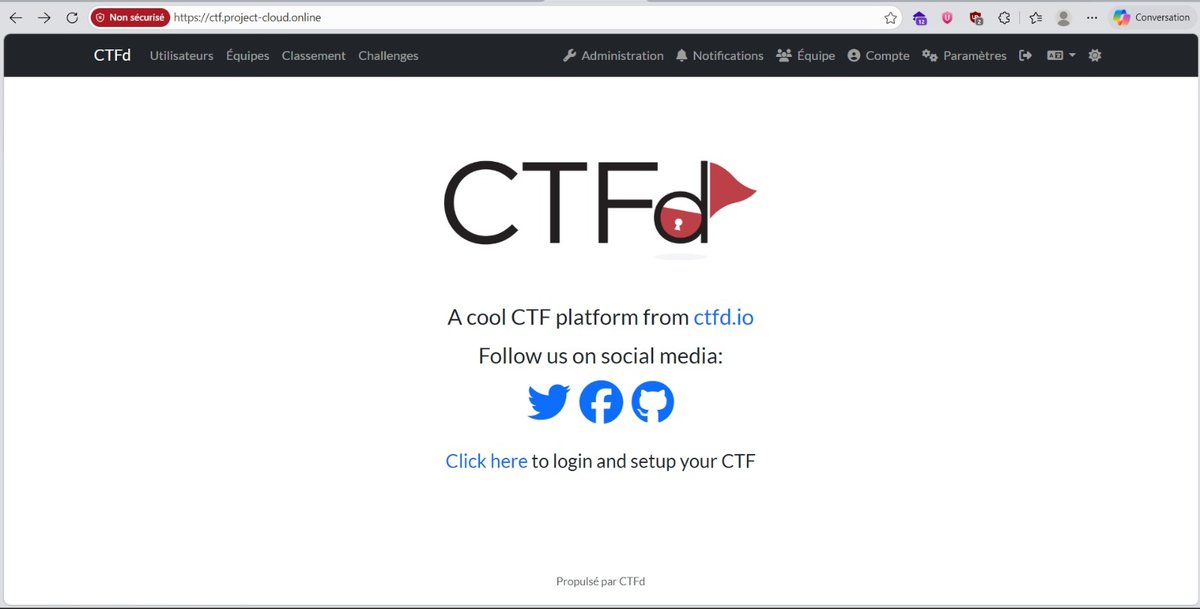 CTFd, ready to host cybersecurity competitions for the club.
Lessons and skills that stuck
A few things I’d genuinely put on a résumé rather than just a project list:
- Docker Compose orchestration with real network segmentation, not just “everything on one bridge.”
- Pipeline-as-Code with Jenkins declarative syntax, including debugging the boring-but-real issues (socket permissions, Git ownership, proxy headers) that never show up in tutorials.
- Reverse proxy design for multi-domain, multi-backend routing with SSL offloading.
- Shift-left security: wiring a scanner into the pipeline so it blocks, not just reports.
- Production monitoring literacy: reading Grafana dashboards to explain why a metric looks the way it does, not just that it exists.
- Incident communication: designing alerts that give a teammate everything they need without making them open a dashboard.
What’s next
A few directions I want to push this further: HashiCorp Vault for secrets instead of Jenkins credentials, SAST/SCA scanning alongside the Trivy image scan for full shift-left coverage, and a staging environment gated behind a VPN for safer pentest practice against the same stack.
Full source: github.com/omar21123/cloud_projet